

CRA Public File
The contents are as follows:
Memo in reference to written comments
Copy of the most recent CRA Evaluation prepared by the OCС
Listing of all the bank's branches with locations, phone numbers, and hours of operation
Memo regarding branch openings and closings
Brochure listing services
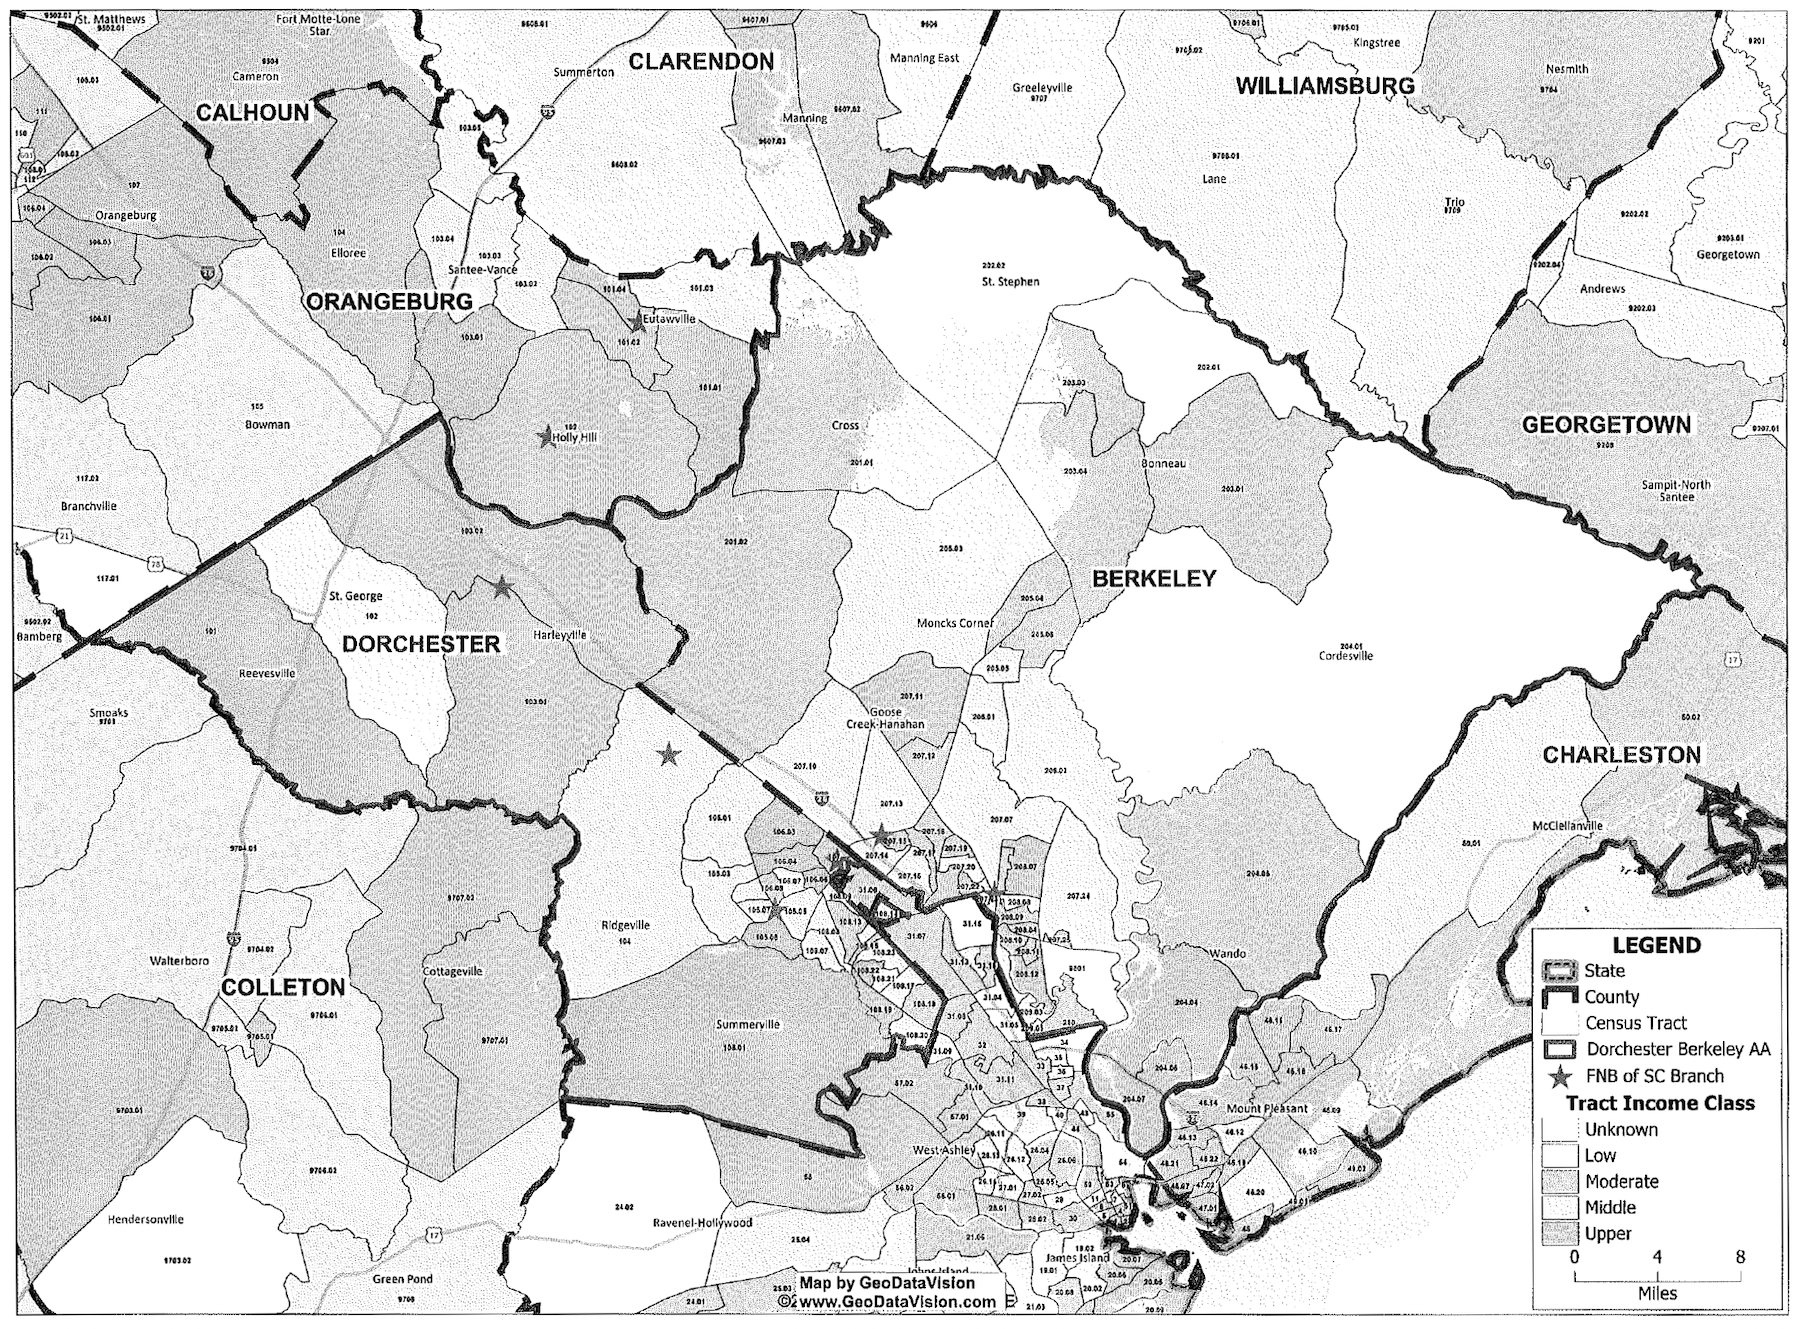
Map of assessment area
Home Mortgage Disclosure (HMDA) data
Memo in reference to bank's loan to deposit ratio
Our Community Reinvestment Mission Statement
CRA Assessment for new loans booked in 2025
You may request copies of the information from this file. Copies will be furnished to you within five days of your request. We may charge a reasonable fee not to exceed the cost of copying and mailing (if applicable).
PUBLIC DISCLOSURE
October 7, 2024
COMMUNITY REINVESTMENT ACT PERFORMANCE EVALUATION
First National Bank of South Carolina
Charter Number 10680
801 Gilway Street
Holly Hill, South Carolina 29059-3421
Office of the Comptroller of the Currency
101 South Tryon Street, Suite 400
Charlotte, NC 28280
NOTE: This document is an evaluation of this institution's record of meeting the credit needs of its entire community, including low- and moderate-income neighborhoods, consistent with safe and sound operation of the institution. This evaluation is not, and should not be construed as, an assessment of the financial condition of this institution. The rating assigned to this institution does not represent an analysis, conclusion, or opinion of the federal financial supervisory agency concerning the safety and soundness of this financial institution.
Overall CRA Rating
Institution's CRA Rating: This institution is rated Satisfactory.
The lending test is rated: Satisfactory.
The major factors that support this rating include:
The Lending Test rating is based on the performance in the State of South Carolina, which reflected an excellent geographic distribution and reasonable distribution of loans to borrowers of different income levels and businesses of different revenue sizes.
The loan-to-deposit (LTD) ratio during the evaluation period is reasonable.
A substantial majority of originated loans during this three-year evaluation period were inside the bank's assessment areas (AAs).
Loan-to-Deposit Ratio
Considering the bank's size, financial condition, and credit needs of the AA(s), the bank's loan to-deposit ratio is reasonable.
During the 12-quarter period of the evaluation cycle, the bank's quarterly loan-to-deposit ratio averaged 41.79 percent, with a range of 37.33 percent to 49.48 percent. The bank's average quarterly LTD ratio is reasonable when compared to the average quarterly LTD ratio of 62.0 percent for similar asset-sized institutions in South Carolina. The average quarterly LTD ratio for similar asset-sized institutions ranged from a quarterly low of 23.69 percent to a high of 92.95 percent over the same period.
Lending in Assessment Area
A substantial majority of the bank's loans are inside its assessment areas.
The bank originated 93.5 percent of its total loans inside the bank's AAs during the evaluation period. This analysis is performed at the bank level, rather than the AA level. This percentage does not include extensions of credit by affiliates that may be considered under the other performance criteria.
Table D - Lending Inside and Outside of the Assessment Area
| Loan Category | Number of Loans - Inside | Number of Loans - Outside | Total # | Dollar Amount of Loans $(000s) - Inside | Dollar Amount of Loans $(000s) - Outside | Total $ | ||||
|---|---|---|---|---|---|---|---|---|---|---|
| # | % | # | % | $ | % | $ | % | |||
| Small Business | 90 | 97.8 | 2 | 2.2 | 92 | 10,895 | 82.6 | 2,300 | 17.4 | 13,195 |
| Home Mortgage | 68 | 88.3 | 9 | 11.7 | 77 | 14,763 | 86.6 | 2,286 | 13.4 | 17,049 |
| Total | 158 | 93.5 | 11 | 6.5 | 169 | 25,658 | 84.8 | 4,586 | 15.2 | 30,244 |
Description of Institution
First National Bank of South Carolina (FNB) is an intrastate bank headquartered in Holly Hill, South Carolina. It is wholly owned by FNB Corporation.
As of June 30, 2024, total assets were $284.4 million, with tier 1 capital totaling $32.7 million and representing 11.49 percent of total assets. FNB's loan portfolio totaled $135.4 million with the bank's primary products being represented by non-farm non-residential lending, and 1-4 family residential real estate lending. These two categories represented 47.57 percent and 31.34 percent of total loans respectively.
For the three-year evaluation period of January 1, 2021, through December 31, 2023, commercial loans and residential mortgage loans represented the majority of the bank's total loan originations by dollar amount.
FNB has two assessment areas (AAs) consisting of Berkeley and Dorchester Counties in the Charleston-North Charleston, SC MSA and five contiguous census tracts in Orangeburg County, a non-MSA. The bank operates eight full-service branches in these two AAs. The main office in Holly Hill and one branch office are located in the western portion of Orangeburg County, and the remaining six branches are in Berkeley and Dorchester counties. FNB operates drive-up windows and has automated teller machines (ATMs) at each branch location. There are no standalone ATMs.
FNB offers numerous deposit and savings accounts for both consumer and commercial customers. The bank also offersa wide range of commercial, consumer, and home mortgage loans for various purposes. Home mortgage products include conventional, government-insured, and guaranteed loans through the Federal Housing Administration (FHA), the Veterans Administration (VA), and the United States Department of Agriculture.
There are no legal, financial, or other factors impeding the bank's ability to meet the credit needs within its AAs. The bank received a "Satisfactory" rating at the previous CRA evaluation dated September 27, 2021.
Scope of the Evaluation
Evaluation Period/Products Evaluated
This performance evaluation (PE) assesses the bank's CRA performance under the Small Bank procedures, which includes the Lending Test. The Lending Test evaluates the bank's record of meeting the credit needs of its AAs through its lending activities, which for this evaluation period was small business loans and residential mortgage loans. For this evaluation, we reviewed samples of these loan types. The evaluation period covers the bank's performance from January 1, 2021, through December 31, 2023. The consideration and evaluation of community development activities is optional under the Small Bank examination procedures and were not completed for this review.
Due to changes to demographic data and census tract income-level designations that resulted from the 2020 U.S. Census data that became effective January 1, 2022, the OCC conducted a separate analysis of FNB's lending performance during the January 1, 2021 through December 31, 2021 period (2021 period), and from the January 1, 2022 through December 31, 2023 period (2022-2023 combined period).
Small business and home mortgage loans in the Orangeburg County, AA were not evaluated due to the bank not originating a sufficient volume in the AA for a meaningful analysis.
Selection of Areas for Full-Scope Review
In each state where the bank has an office, one or more of AAs within that state was selected for a full-scope review. For purposes of this evaluation, bank delineated assessment areas located within the same metropolitan statistical area (MSA), multistate metropolitan statistical area (MMSA), or combined statistical area (CSA) are combined and evaluated as a single AА. Similarly, bank delineated non-MSA AAs within the same state are combined and evaluated as a single area. These combined AAs may be evaluated as full- or limited-scope. Refer to the "Scope" section under each State Rating for details regarding how full-scope AAs were selected. Refer to appendix A, Scope of Examination, for a list of full- and limited-scope AAs.
Ratings
The bank's overall rating is based solely on its performance in the State of South Carolina.
The MMSA rating and state ratings are based on performance in all bank AAs. Refer to the "Scope" section under each state and MMSA Rating section for details regarding how the areas were weighted in arriving at the respective ratings.
Discriminatory or Other Illegal Credit Practices Review
Pursuant to 12 CFR 25.28(c) or 195.28(c), respectively, in determining a national bank's or federal savings association's (collectively, bank) CRA rating, the OCC considers evidence of discriminatory or other illegal credit practices in any geography by the bank, or in any AA by an affiliate whose loans have been considered as part of the bank's lending performance. As part of this evaluation process, the OCC consults with other federal agencies with responsibility for compliance with the relevant laws and regulations, including the U.S. Department of Justice, the U.S. Department of Housing and Urban Development, and the Bureau of Consumer Financial Protection, as applicable.
The OCC has not identified that this institution (or any affiliate whose loans have been considered as part of the institution's lending performance) has engaged in discriminatory or other illegal credit practices that require consideration in this evaluation.
The OCC will consider any information that this institution engaged in discriminatory or other illegal credit practices, identified by or provided to the OCC before the end ofthe institution's next performance evaluation in that subsequent evaluation, even if the information concerns activities that occurred during the evaluation period addressed in this performance evaluation.
State Rating
State of South Carolina
CRA rating for the State of South Carolina¹: Satisfactory.
The Lending Test is rated: Satisfactory.
The major factors that support this rating include:
The bank exhibits an excellent geographic distribution ofloans in the AAs.
The bank exhibits a reasonable distribution of loans to businesses of different revenue sizes and borrowers of different income levels.
Description of Institution's Operations in South Carolina
FNB identifies portions of the Charleston-North Charleston, SC MSA and of Orangeburg County, SC Non-MSA as its two assessment areas. The bank operates eight full-service office locations with deposit-taking ATMs and drive-up windows. Two branches are in Orangeburg County, four are located in Dorchester County, and the remaining two are located in Berkeley County. As previously noted, FNB offers traditional banking products and services, including fixed and adjustable rate residential mortgage loans, home equity line of credit loans, consumer, and commercial loans. Additionally, the bank offers a range of deposit products and services, including checking, savings, certificate of deposits, and safe deposit boxes. The AAs do not arbitrarily exclude low- or -moderate income (LMI) census tracts (CTs). No CTs were designated as underserved as of this examination. Furthermore, no branch offices were closed or opened during this evaluation period.
Charleston-North Charleston, SC MSA Assessment Area
Demographic Data and Market Share
The Charleston-North Charleston, SC MSA AA is comprised of Berkeley and Dorchester counties. Based on the 2020 American Community Survey (ACS) U.S. Census data and 2021 Dunn and Bradstreet (D&B) data, the MSA had 70 CTs during the 2021 evaluation period and 79 CTs during the 2022-2023 evaluation period. In 2021, the MSA consisted of no low-income CTs, 20 moderate-income CTs, 36 middle-income CTs, 13 upper-income CTs, and one tract with no income data reported. In 2022-2023, the MSA consisted of five low-income CTs, 28 moderate-income CTs, 30 middle-income CTs, 15 upper-income CTs, and the one tract with no income data reported.
1 This rating reflects performance within the state. The statewide evaluations do not reflect performance in the parts of those states contained within a MMSA.
FNB faces moderate deposit competition in the SC MSA. According to the June 30, 2023, Federal Deposit Insurance Corporation (FDIC) summary of deposit data, the bank ranked ninth out of 35 institutions in the market, holding 3.36 percent of the total deposit market share. The top three competitors holding 39.54 percent of the deposit market share were REV Federal Credit Union (15.53 percent), SouthState Bank N.A. (12.41 percent), and First-Citizens Bank & Trust Co. (11.60 percent), respectively.
The bank faces moderate lending competition in the MSA. According to 2023 peer mortgage data provided by 2020 US Census SF1/SF3, FNB ranked eighty-sixth among 450 lenders in the AA. The bank made 29 loans in the AA capturing 0.18 percent of market share by loan count. The top three lenders in the AA that held a combined 16.93 percent of the market share were PennyMac Loan Services, LLC (7.28 percent), DHI Mortgage Company, LP (5.15 percent), and Lennar Mortgage, LLC (4.50 percent).
Employment and Economic Factors
Historically, the Charleston-North Charleston, SC MSA unemployment rates have been lower compared to the State of South Carolina. The U.S. Bureau of Labor Statistics (USBLS) reported the annual average unemployment rate in the AA for 2021, 2022, and 2023 was 3.60 percent, 2.95 percent, and 2.65 percent, respectively. For this same period, the overall unemployment rates for the state of South Carolina were above these rates, at 3.9 percent, 3.2 percent, and 3.0 percent, respectively.
According to the United States Bureau of Labor Statistics, the primary industries in the AА include mining, manufacturing, and trade & transportation. The top three employers within the AA are the Medical University of South Carolina, Boeing Company, and Robert Bosch, LLC.
As part of the CRA Public Evaluation, three community contacts were reached out to for an update on economic conditions and community needs. The contacts stressed the level of growth in the area and the need for housing for LMI individuals, retail and service businesses, technical assistance to small existing businesses and startup businesses, and financial literacy classes to the LMI communities.
Housing
The 2020 ACS U.S. Census data (for analysis of 2023) reported that single family homes make up most of the housing units in the AA at 73.43 percent. Multi-family units accounted for 11.08 percent of the housing units in the AA. Total rental occupied units are 25.53 percent. The median housing value in the AA was $212,105 for the 2023 evaluation period and the median gross rent was $1,143 per month.
Five of the CTs in the AA are designated as low-income while 28 CTs are designated as moderate-income. LMI households make up 38.47 percent of total households. Households below the poverty level represent 10.82 percent of total households.
The table below provides a summary of the demographics that includes housing, business, and farm information for the Charleston-North Charleston, South Carolina MSA AА.
Table A- Demographic Information of the Assessment Area
Assessment Area: 2023 Charleston-North Charleston, SC MSA
| Demographic Characteristics | # | Low % of # | Moderate % of # | Middle % of # | Upper % of # | NA* % of # |
|---|---|---|---|---|---|---|
| Geographies (Census Tracts) | 79 | 6.3 | 35.4 | 38.0 | 19.0 | 1.3 |
| Population by Geography | 391,401 | 4.3 | 30.3 | 42.5 | 22.9 | 0.0 |
| Housing Units by Geography | 147,719 | 5.6 | 34.0 | 40.0 | 20.4 | 0.0 |
| Owner-Occupied Units by Geography | 98,824 | 4.8 | 29.8 | 41.9 | 23.5 | 0.0 |
| Occupied Rental Units by Geography | 37,712 | 5.8 | 42.8 | 37.2 | 14.1 | 0.0 |
| Vacant Units by Geography | 11,183 | 12.7 | 40.5 | 32.2 | 14.6 | 0.0 |
| Businesses by Geography | 50,008 | 3.7 | 28.5 | 40.0 | 27.7 | 0.0 |
| Farms by Geography | 1,232 | 5.7 | 33.1 | 38.4 | 22.8 | 0.0 |
| Family Distribution by Income Level | 95,941 | 23.0 | 19.0 | 22.0 | 36.0 | 0.0 |
| Household Distribution by Income Level | 136,536 | 23.2 | 17.0 | 19.6 | 40.2 | 0.0 |
| Median Family Income MSA - 16700 Charleston-North Charleston, SC MSA | $82,122 | Median Housing Value | $212,105 | |||
Median Gross Rent $1,143
Families Below Poverty Level 8.6%
Source: 2020 U.S. Census and 2023 D&B Data
Due to rounding, totals may not equal I 00. 0%
(*) The NA category consists of geographies that have not been assigned an income classification.
Orangeburg County, SC Non-MSA Assessment Area
Demographic Data and Market Share
Orangeburg County is a non-MSA area located in the central portion of South Carolina. The AA is contiguous to Berkeley and Dorchester County. The bank operates its main office in the city of Holly Hill and one full-service branch office location in the city of Eutawville in this AA. Based on the 2020 American Community Survey (ACS) U.S. Census data and 2021 Dunn and Bradstreet (D&B), the Orangeburg County, SC Non-MSA AA had three CTs (partial county) during the 2021 evaluation period and five CTs (partial county) during the 2022-2023 evaluation period. In 2021, the AA consisted of no low-income CTs, one moderate-income CT, and two middle-income CTs. In 2022-2023, the AA consisted of no low-income CTs, two moderate-income CTs, one middle7 income CT, and two upper-income CTs. Based on the size of Orangeburg County and the bank's two office locations being in the southwest portion of the county, the bank cannot be expected to reasonably serve the entire county. No branch locations were closed or opened during the evaluation period.
FNB faces low minimal deposit competition in the Orangeburg County, SC AA. According to June 30, 2023, Federal Deposit Insurance Corporation (FDIC) summary of deposit data, the bank ranked second out of two institutions in the market, holding 46.63 percent of total deposits. The bank also faces some lending competition in the AA. According to 2023 mortgage peer data, FNB ranked eighteenth among 77 lenders in the AA. The bank made three loans in the AA capturing 1.75 percent of market share by loan count. The top three lenders in the AA holding a combined 15.79 percent of the market share were Newrez, LLC (5.85 percent), Vanderbilt Mortgage and Financing (5.85 percent), and PrimeLending (4.09 percent).
Employment and Economic Factors
The U.S. Bureau of Labor Statistics (USBLS) reported the annual average unemployment rate in Orangeburg County for 2021, 2022, and 2023 was 6.8 percent, 5.0 percent, and 4.4 percent, respectively. The unemployment rates for Orangeburg County exceed those of the State of South Carolina as cited above for the same time periods.
The primary industries in Orangeburg County include healthcare, maintenance, and office and administrative services. The top three employers according to the State of South Carolina are Husqvarna, Medical University of South Carolina, and Food Lion Distribution Center.
As part of the CRA Public Evaluation, a local community contact was relied upon in determining local economic conditions and community needs. The contact identified the need for more infrastructure, specifically another wastewater treatment facility, that would increase the ability to construct more affordable housing for LMI families. The contact also identified the need for more 7(a) and 504 loans to assist small business owners and financing to build more local parks and recreation areas to improve the county's appeal to bring in people
Housing
The 2020 ACS U.S. Census data (for analysis of 2023) reported that single family homes make up most of the housing units in the AA at 59.68 percent. Multi-family units accounted for 0.30 percent of the housing units in the AA. Total rental occupied units are 19.61 percent. The median housing value in the AA was $102,453 for the 2023 evaluation period, and the median gross rent was $565 per month.
None of the CTs in the AA are designated as low-income, and only two out of the five are moderate-income (LMI); however, LMI households make up 55.43 percent of total households. Households below the poverty level represent 21.91 percent of total households.
The table below provides a summary of the demographics that includes housing, business, and farm information for the Orangeburg County, SC АА.
Table A - Demographic Information of the Assessment Area
Assessment Area: 2023 Orangeburg County, SC
| Demographic Characteristics | # | Low % of # | Moderate % of # | Middle % of # | Upper % of # | NA* % of # |
|---|---|---|---|---|---|---|
| Geographies (Census Tracts) | 5 | 0.0 | 40.0 | 20.0 | 40.0 | 0.0 |
| Population by Geography | 9,389 | 0.0 | 62.1 | 9.2 | 28.7 | 0.0 |
| Housing Units by Geography | 5,595 | 0.0 | 55.7 | 11.8 | 32.6 | 0.0 |
| Owner-Occupied Units by Geography | 3,253 | 0.0 | 51.2 | 11.8 | 37.0 | 0.0 |
| Occupied Rental Units by Geography | 1,097 | 0.0 | 67.8 | 3.8 | 28.4 | 0.0 |
| Vacant Units by Geography | 1,245 | 0.0 | 56.5 | 18.8 | 24.7 | 0.0 |
| Businesses by Geography | 1,025 | 0.0 | 62.6 | 7.4 | 30.0 | 0.0 |
| Farms by Geography | 39 | 0.0 | 51.3 | 10.3 | 38.5 | 0.0 |
| Family Distribution by Income Level | 2,353 | 28.1 | 19.0 | 12.1 | 40.8 | 0.0 |
| Household Distribution by Income Level | 4,350 | 27.6 | 18.2 | 20.3 | 33.9 | 0.0 |
| Median Family Income MSA - 16700 Charleston-North Charleston, SC MSA | $53,588 | Median Housing Value | $102,453 | |||
Median Gross Rent $565
Families Below Poverty Level 21.4%
Source: 2020 U.S. Census and 2023 D&B Data
Due to rounding, totals may not equal 100. 0%
(*) The NA category consists of geographies that have not been assigned an income classification.
Scope of Evaluation in South Carolina
For purposes of this evaluation, we performed a full-scope review of the Charleston-North Charleston SC MSA AA for calendar years 2021, 2022, and 2023. As noted previously, small business and home mortgage loans in the Orangeburg County, SC AA were not evaluated due to the bank not originating a sufficient volume in the AA fora meaningful analysis. As such, the Charleston-North Charleston, SC MSA AA was the most heavily weighted.
More weight was placed on small loans to businesses as it represents the majority of the bank's lending activity based on information provided by the bank.
LENDING TEST
The bank's performance under the Lending Test in South Carolina is rated Satisfactory.
Conclusions for (Area/Areas) Receiving (a Full-Scope Review/Full-Scopе Reviews)
Based on a full-scope review, the bank's performance in the Charleston-North Charleston, SC MSA AA is adequate.
Distribution of Loans by Income Level of the Geography
The bank exhibits excellent geographic distribution of loans in the State.
Home Mortgage Loans
Refer to Table O in the State of South Carolina section of appendix D for the facts and data used to evaluate the geographic distribution of the bank's home mortgage loan originations and purchases.
Charleston-North Charleston, SC MSA AA
2021
The percentage of home mortgage loans in moderate-income geographies exceeded the percentage of owner-occupied housing units located in those geographies. It also exceeded peer lending in moderate-income geographies.
2022-2023
The percentage of home mortgage loans in low-income geographies was below the percentage of owner-occupied housing units located in those geographies and peer lending. The percentage of loans in moderate-income geographies exceeded the percentage of owner-occupied housing units located in those geographies and peer lending.
Small Loans to Businesses
Refer to Table Q in the State of South Carolina section of appendix D for the facts and data used to evaluate the geographic distribution of the bank's originations and purchases of small loans to businesses.
Charleston-North Charleston, SC MSA AA
2021
The percentage of small business loans in moderate-income geographies exceeded the percentage of businesses located in those geographies. It also exceeded peer lending in moderate-income geographies.
2022-2023
The percentage of small business loans in low-income geographies exceeded the percentage of businesses located in those geographies and peer lending. The percentage of loans in moderateincome geographies exceeded the percentage of businesses located in those geographies and peer lending.
Distribution of Loans by Income Level of the Borrower
The bank exhibits a reasonable distribution of loans to individuals of different income levels and businesses and farms of different revenue sizes, given the product lines offered by the bank.
Home Mortgage Loans
Refer to Table P in the State of South Carolina section of appendix D for the facts and data used to evaluate the borrower distribution of the bank's home mortgage loan originations and purchases.
Charleston-North Charleston, SC MSA AA
2021
The percentage of home mortgage loans was below the percentage of low-income families but exceeded peer lending. The percentage of loans exceeded the percentage of moderate-income families and peer lending.
2022-2023
The percentage of home mortgage loans was well below the percentage of low-income families but exceeded peer lending. The percentage of loans was below the percentage of moderate income families and peer lending.
Small Loans to Businesses
Refer to Table R in the State of South Carolina section of appendix D for the facts and data used to evaluate the borrower distribution of the bank's originations and purchases of small loans to businesses.
Charleston-North Charleston, SC MSA AA
2021
The distribution of small loans to businesses with gross annual revenue under $1 million exceeded the percentage of businesses and peer lending.
2022-2023
The distribution of small loans to businesses with gross annual revenue under $1 million was near to the percentage of businesses and exceeded peer lending.
Responses to Complaints
There were no complaints related to the institution's CRA performance within the state of South Carolina.
Appendix A: Scope of Examination
The following table identifies the time period covered in this evaluation, affiliate activities that were reviewed, and loan products considered. The table also reflects the MSAs and non-MSAS that received comprehensive examination review, designated by the term "full-scope," and those that received a less comprehensive review, designated by the term "limited-scope".
Time Period Reviewed: 01/01/21 to 12/31/23
Bank Products Reviewed: Home mortgage and small business
| Affiliate(s) | Affiliate Relationship | Products Reviewed |
|---|---|---|
| None | None | None |
List of Assessment Areas and Type of Examination
| Rating and Assessment Areas | Type of Exam | Other Information |
|---|---|---|
| South Carolina | ||
| Charleston-North Charleston, SC MSA | Full-Scope | Counties of Berkeley and Dorchester |
| Orangeburg County, SC | Full-Scope | Partial County |
Appendix B: Summary of State Ratings
RATINGS - First National Bank of South Carolina
| Overall Bank | Lending Test Rating |
|---|---|
| First National Bank of South Carolina | Satisfactory |
| State: South Carolina | Satisfactory |
Appendix C: Definitions and Common Abbreviations
The following terms and abbreviations are used in this performance evaluation, including the CRA tables. The definitions are intended to provide the reader with a general understanding of the terms, not a strict legal definition.
Affiliate: Any company that controls, is controlled by, or is under common control with another company. A company is under common control with another company if the same company directly or indirectly controls both companies. For example, a bank subsidiary is controlled by the bank and is, therefore, an affiliate.
Aggregate Lending (Aggt.): The number of loans originated and purchased by all reporting lenders (HMDA or CRA) in specified income categories as apercentage of the aggregate number of loans originated and purchased by all reporting lenders in the state/assessment area.
Census Tract (CT): A small, relatively permanent statistical subdivision of a county delineated by a local committee of census data users for the purpose of presenting data. Census tracts nest within counties, and their boundaries normally follow visible features, but may follow legal geography boundaries and other non-visible features in some instances, Census tracts ideally contain about 4,000 people and 1,600 housing units.
Combined Statistical Area (CSA): A geographic entity consisting of two or more adjacent Core Based Statistical Areas with employment interchange measures of at least 15. An employment interchange measure is a measure of ties between two adjacent entities. The employment interchange measure is the sum of the percentage of workers living in the smaller entity who work in the larger entity and the percentage of employment in the smaller entity that is accounted for by workers who reside in the larger entity.
Community Development (CD): Affordable housing (including multifamily rental housing) for low- or moderate-income individuals; community services targeted to low- or moderate-income individuals; activities that promote economic development by financing businesses or farms that meet Small Business Administration Development Company or Small Business Investment Company programs size eligibility standards or have gross annual revenues of $1 million or less; or activities that revitalize or stabilize low- or moderate-income geographies, distressed or underserved nonmetropolitan middle-income geographies, or designated disaster areas.
Community Reinvestment Act (CRA): The statute that requires the OCC to evaluate a bank's record of meeting the credit needs of its entire community, including LMI areas, consistent with the safe and sound operation of the bank, and to take this record into account when evaluating certain corporate applications filed by the bank. Consumer Loan(s): A loan(s) to one or more individuals for household, family, or other personal expenditures. A consumer loan does not include a home mortgage, small business, or small farm loan. This definition includes the following categories: motor vehicle loans, credit card loans, other secured consumer loans, and other unsecured consumer loans.
Family: Includes a householder and one or more other persons living in the same household who are related to the householder by birth, marriage, or adoption. The number of family households always equals the number of families; however, a family household may also include nonrelatives living with the family. Families are classified by type as either a married-couple family or other family, which is further classified into 'male householder' (a family with a male householder' and no wife present) or 'female householder' (a family with a female householder and no husband present).
Full-Scope Review: Performance under the Lending, Investment, and Service Tests is analyzed considering performance context, quantitative factors (e.g., geographic distribution, borrower distribution, and total number and dollar amount of investments), and qualitative factors (e.g., innovativeness, complexity, and responsiveness).
Geography: A census tract delineated by the United States Bureau of the Census in the most recent decennial census.
Home Mortgage Disclosure Act (HMDA): The statute that requires certain mortgage lenders that conduct business or have banking offices in a metropolitan statistical area to file annual summary reports of their mortgage lending activity. The reports include such data as the race, gender, and the income of applicants, the amount of loan requested, the disposition of the application (e.g., approved, denied, and withdrawn), the lien status of the collateral, any requests for preapproval, and loans for manufactured housing.
Home Mortgage Loans: A closed-end mortgage loan or an open-end line of credit as these terms are defined under 12 CFR 1003.2, and that is not an excluded transaction under 12 CFR 1003.3(c)(1) through (c)(10) and (c)(13).
Household: Includes all persons occupying a housing unit. Persons not living in households are classified as living in group quarters. In 100 percent tabulations, the count of households always equals the count of occupied housing units.
Limited-Scope Review: Performance under the Lending, Investment, and Service Tests is analyzed using only quantitative factors (e.g., geographic distribution, borrower distribution, total number and dollar amount of investments, and branch distribution).
Low-Income Individual: Individual income that is less than 50 percent of the area median income.
Low Income Geography: A census tract with a median family income that is less than 50 percent. Market Share: The number of loans originated and purchased by the institution as a percentage of the aggregate number of loans originated and purchased by all reporting lenders in the state/assessment area.
Median Family Income (MFI): The median income determined by the U.S. Census Bureau every five years and used to determine the income level category of geographies. The median is the point at which half of the families have income above, and half below, a range of incomes. Also, the median income determined by the Federal Financial Institutions Examination Council (FFIEC) annually that is used to determine the income level category of individuals. For any given area, the median is the point at which half of the families have income above, and half below, a range of incomes.
Metropolitan Division: As defined by Office of Management and Budget, a county or group of counties within a Core Based Statistical Area that contains an urbanized population of at least 2.5 million. A Metropolitan Division consists of one or more main/secondary counties that represent an employment center or centers, plus adjacent counties associated with the main/secondary county or counties through commuting ties.
Metropolitan Statistical Area: An area, defined by the Office of Management and Budget, as a core based statistical area associated with at least one urbanized area that has a population of at least 50,000. The Metropolitan Statistical Area comprises the central county or counties containing the core, plus adjacent outlying counties having a high degree of social and economic integration with the central county or counties as measured through commuting.
Middle-Income: Individual income that is at least 80 percent and less than 120 percent of the area median income, or a median family income that is at least 80 percent and less than 120 percent, in the case of a geography
Moderate-Income: Individual income that is at least 50 percent and less than 80 percent of the area median income, or a median family income that is at least 50 percent and less than 80 percent, in the case of a geography.
Multifamily: Refers to a residential structure that contains five or more units.
Owner-Occupied Units: Includes units occupied by the owner or co-owner, even if the unit has not been fully paid for or is mortgaged.
Qualified Investment: A qualified investment is defined as any lawful investment, deposit, membership share, or grant that has as its primary purpose community development.
Rating Area: A rated area is a state or multi-state metropolitan statistical area. For an institution with domestic branches in only one state, the institution's CRA rating would be the state rating. If an institution maintains domestic branches in more than one state, the institution will receive a rating for each state in which those branches are located. If an institution maintains domestic branches in two or more states within a multi-state metropolitan statistical area, the institution will receive a rating for the multi-state metropolitan statistical area.
Small Loan(s) to Business(es): A loan included in 'loans to small businesses' as defined in the Consolidated Report of Condition and Income (Call Report) instructions. These loans have original amounts of $1 million or less and typically are either secured by nonfarm or nonresidential real estate or are classified as commercial and industrial loans.
Small Loan(s) to Farm(s): A loan included in ‘loans to small farms' as defined in the instructions for preparation of the Consolidated Report of Condition and Income (Call Report). These loans have original amounts of $500,000 or less and are either secured by farmland, or are classified as loans to finance agricultural production and other loans to farmers.
Tier 1 Capital: The total of common shareholders' equity, perpetual preferred shareholders' equity with non-cumulative dividends, retained earnings and minority interests in the equity accounts of consolidated subsidiaries.
Upper-Income: Individual income that is at least 120 percent of the area median income, or a median family income that is at least 120 percent, in the case of a geography.
Appendix D: Tables of Performance Data
Content of Standardized Tables
A separate set of tables is provided for each state. All multistate metropolitan statistical areas, if applicable, are presented in one set of tables. References to the "bank" include activities of any affiliates that the bank provided for consideration (refer to appendix A: Scope of the Examination). For purposes of reviewing the Lending Test tables, the following are applicable: (1) purchased are treated as originations; and (2) "aggregate"is the percentage of the aggregate number of reportable loans originated and purchased by all HMDA or CRA-reporting lenders in the MMSA/assessment area. Deposit data are compiled by the FDIC and are available as of June 30th of each year. Tables without data are not included in this PЕ.
The following is a listing and brief description of the tables included in each set:
Table 0. - Assessment Area Distribution of Home Mortgage Loans by Income Category of the Geography - Compares the percentage distribution of the number of loans originated and purchased by the bank in low-, moderate-, middle-, and upper-income geographies to the percentage distribution of owner-occupied housing units throughout those geographies. The table also presents aggregate peer data for the years the data is available.
Table P. - Assessment Area Distribution of Home Mortgage Loans by Income Category of the Borrower - Compares the percentage distribution of the number of loans originated and purchased by the bank to low-, moderate-, middle-, and upper-income borrowers to the percentage distribution of families by income level in each MMSA/assessment area. The table also presents aggregate peer data for the years the data is available.
Table Q. - Assessment Area Distribution of Loans to Small Businesses by Income Category of the Geography - The percentage distribution of the number of small loans (less than or equal to $1 million) to businesses that were originated and purchased by the bank in low-, moderate-, middle-, and upper-income geographies compared to the percentage distribution of businesses (regardless of revenue size) in those geographies. Because aggregate small business data are not available for geographic areas smaller than counties, it may be necessary to compare bank loan data to aggregate data from geographic areas larger than the bank's assessment area.
Table R. - Assessment Area Distribution of Loans to Small Businesses by Gross Annual Revenue - Compares the percentage distribution of the number of small loans (loans less than or equal to $1 million) originated and purchased by the bank to businesses with revenues of $1 million or less to: 1) the percentage distribution of businesses with revenues of greater than $1 million; and, 2) the percentage distribution of businesses for which revenues are not available. The table also presents aggregate peer small business data for the years the data is available.
The total loan amount presented in the tables for each assessment area may differ from the total loan amount reported in the aggregate table due to how the underlying loan data is rounded in each table.
Table 0: Assessment Area Distribution of Home Mortgage Loans by Income Category of the Geography - 2021
| Total Home Mortgage Loans | Low-Income Tracts | Moderate-Income Tracts | Middle-Income Tracts | Upper-Income Tracts | Not Available-Income Tracts | |||||||||||||
|---|---|---|---|---|---|---|---|---|---|---|---|---|---|---|---|---|---|---|
| Assessment Area | # | $ | % of Total | % of Owner-Occupied Housing Units | % Bank Loans | Aggregate | % of Owner-Occupied Housing Units | % Bank Loans | Aggregate | % of Owner-Occupied Housing Units | % Bank Loans | Aggregate | % of Owner-Occupied Housing Units | % Bank Loans | Aggregate | % of Owner-Occupied Housing Units | % Bank Loans | Aggregate |
| Charleston-North Charleston, SC MSA | 16 | 3,929 | 94.1 | 0.0 | 0.0 | 0.0 | 23.8 | 31.3 | 11.9 | 54.1 | 37.5 | 58.4 | 22.1 | 31.3 | 29.8 | 0.0 | 0.0 | 0.0 |
| Orangeburg County, SC | 1 | 160 | 5.9 | 0.0 | 0.0 | 0.0 | 15.0 | 100.0 | 10.6 | 63.1 | 0.0 | 59.0 | 22.0 | 0.0 | 30.4 | 0.0 | 0.0 | 0.0 |
| Total | 17 | 4,089 | 100.0 | 0.0 | 0.0 | 0.0 | 21.9 | 35.3 | 11.8 | 56.0 | 35.3 | 58.4 | 22.1 | 29.4 | 29.8 | 0.0 | 0.0 | 0.0 |
Source: 2020 U.S Census; 01/01/2021 - 12/31/2021 Bank Data, "--" data not available. Due to rounding, totals may not equal 100.0
The total loan amount presented in the tables for each assessment area may differ from the total loan amount reported in the aggregate table due to how the underlying loan data is rounded in each table.
Table 0: Assessment Area Distribution of Home Mortgage Loans by Income Category of the Geography - 2022-2023
| Total Home Mortgage Loans | Low-Income Tracts | Moderate-Income Tracts | Middle-Income Tracts | Upper-Income Tracts | Not Available-Income Tracts | |||||||||||||
|---|---|---|---|---|---|---|---|---|---|---|---|---|---|---|---|---|---|---|
| Assessment Area | # | $ | % of Total | % of Owner-Occupied Housing Units | % Bank Loans | Aggregate | % of Owner-Occupied Housing Units | % Bank Loans | Aggregate | % of Owner-Occupied Housing Units | % Bank Loans | Aggregate | % of Owner-Occupied Housing Units | % Bank Loans | Aggregate | % of Owner-Occupied Housing Units | % Bank Loans | Aggregate |
| Charleston-North Charleston, SC MSA | 46 | 10,133 | 90.2 | 4.8 | 0.0 | 2.2 | 29.8 | 39.1 | 23.1 | 41.9 | 41.3 | 41.0 | 23.5 | 19.6 | 33.7 | 0.0 | 0.0 | 0.0 |
| Orangeburg County, SC | 5 | 541 | 90.8 | 0.0 | 0.0 | 0.0 | 51.2 | 40.0 | 52.0 | 11.8 | 0.0 | 25.1 | 37.0 | 40.0 | 22.8 | 0.0 | 0.0 | 0.0 |
| Total | 51 | 10,674 | 100.0 | 4.6 | 0.0 | 2.2 | 30.5 | 39.2 | 23.4 | 41.0 | 46.9 | 40.9 | 23.9 | 21.9 | 33.6 | 0.0 | 0.0 | 0.0 |
Source: 2020 U.S Census; 01/01/2021 - 12/31/2021 Bank Data, "--" data not available. Due to rounding, totals may not equal 100.0
The total loan amount presented in the tables for each assessment area may differ from the total loan amount reported in the aggregate table due to how the underlying loan data is rounded in each table.
Table P: Assessment Area Distribution of Home Mortgage Loans by Income Category of the Borrower - 2021
| Total Home Mortgage Loans | Low-Income Tracts | Moderate-Income Tracts | Middle-Income Tracts | Upper-Income Tracts | Not Available-Income Tracts | |||||||||||||
|---|---|---|---|---|---|---|---|---|---|---|---|---|---|---|---|---|---|---|
| Assessment Area | # | $ | % of Total | % of families | % Bank Loans | Aggregate | % of families | % Bank Loans | Aggregate | % of families | % Bank Loans | Aggregate | % of families | % Bank Loans | Aggregate | % of families | % Bank Loans | Aggregate |
| Charleston-North Charleston, SC MSA | 16 | 3,929 | 94.1 | 22.5 | 18.8 | 6.4 | 18.3 | 25.0 | 20.0 | 22.1 | 25.0 | 22.0 | 37.2 | 31.3 | 25.6 | 0.0 | 0.0 | 25.9 |
| Orangeburg County, SC | 1 | 160 | 5.9 | 23.1 | 0.0 | 3.1 | 17.5 | 0.0 | 12.7 | 19.0 | 0.0 | 22.3 | 40.4 | 100.0 | 38.9 | 0.0 | 0.0 | 23.0 |
| Total | 17 | 4,089 | 100.0 | 22.6 | 17.6 | 6.2 | 18.1 | 23.5 | 19.6 | 21.5 | 23.5 | 22.0 | 37.8 | 35.3 | 26.3 | 0.0 | 0.0 | 25.8 |
Source: 2020 U.S Census; 0 source: 2020 C.S Census; 01/01/2021-12/31/2021 01/0172021 Bank Data, "-" ddata not available. Due to rounding, totals may not equal 100.0
The total loan amount presented in the tables for each assessment area may differ from the total loan amount reported in the aggregate table due to how the underlying loan data is rounded in each table.
Table P: Assessment Area Distribution of Home Mortgage Loans by Income Category of the Borrower - 2022-2023
| Total Home Mortgage Loans | Low-Income Tracts | Moderate-Income Tracts | Middle-Income Tracts | Upper-Income Tracts | Not Available-Income Tracts | |||||||||||||
|---|---|---|---|---|---|---|---|---|---|---|---|---|---|---|---|---|---|---|
| Assessment Area | # | $ | % of Total | % of families | % Bank Loans | Aggregate | % of families | % Bank Loans | Aggregate | % of families | % Bank Loans | Aggregate | % of families | % Bank Loans | Aggregate | % of families | % Bank Loans | Aggregate |
| Charleston-North Charleston, SC MSA | 46 | 10,133 | 90.2 | 23.0 | 13.0 | 5.4 | 19.0 | 15.2 | 21.5 | 22.0 | 19.6 | 24.4 | 36.0 | 47.8 | 25.1 | 0.0 | 4.3 | 23.6 |
| Orangeburg County, SC | 5 | 541 | 9.8 | 28.1 | 20.0 | 3.5 | 19.0 | 40.0 | 15.2 | 12.1 | 20.0 | 21.1 | 40.8 | 20.0 | 40.4 | 0.0 | 0.0 | 19.9 |
| Total | 51 | 10,674 | 100.0 | 23.1 | 13.7 | 5.4 | 19.0 | 17.6 | 21.5 | 21.8 | 19.6 | 24.4 | 36.1 | 45.1 | 25.2 | 0.0 | 3.9 | 23.5 |
Source: 2020 U.S Census; 01/01/2022-12/31/2023 Bank Data, "--" data not available. Due to rounding, totals may not equal 100.0
The total loan amount presented in the tables for each assessment area may differ from the total loan amount reported in the aggregate table due to how the underlying loan data is rounded in each table.
Table Q: Assessment Area Distribution of Loans to Small Businesses by Income Category of the Geography - 2021
| Total Home Mortgage Loans | Low-Income Tracts | Moderate-Income Tracts | Middle-Income Tracts | Upper-Income Tracts | Not Available-Income Tracts | |||||||||||||
|---|---|---|---|---|---|---|---|---|---|---|---|---|---|---|---|---|---|---|
| Assessment Area | # | $ | % of Total | % Businesses | % Bank Loans | Aggregate | % Businesses | % Bank Loans | Aggregate | % Businesses | % Bank Loans | Aggregate | % Businesses | % Bank Loans | Aggregate | % Businesses | % Bank Loans | Aggregate |
| Charleston-North Charleston, SC MSA | 20 | 3,166 | 58.8 | 0.0 | 0.0 | 0.0 | 22.7 | 40.0 | 20.5 | 52.1 | 60.0 | 50.9 | 25.1 | 0.0 | 28.6 | 0.1 | 0.0 | 0.0 |
| Orangeburg County, SC | 14 | 1,514 | 41.2 | 0.0 | 0.0 | 0.0 | 23.3 | 28.6 | 19.2 | 53.2 | 71.4 | 57.5 | 23.5 | 0.0 | 23.4 | 0.0 | 0.0 | 0.0 |
| Total | 34 | 4,680 | 100.0 | 0.0 | 0.0 | 0.0 | 22.8 | 35.3 | 20.3 | 52.3 | 64.7 | 51.9 | 24.8 | 0.0 | 27.8 | 0.1 | 0.0 | 0.0 |
Source: 2021 D&B Data; 01/01/2021 - 12/31/2021 Bank Data; "-" data not available. Due to rounding, totals may not equal 100.0
The total loan amount presented in the tables for each assessment area may differ from the total loan amount reported in the aggregate table due to how the underlying loan data is rounded in each table.
Table Q: Assessment Area Distribution of Loans to Small Businesses by Income Category of the Geography - 2022-2023
| Total Home Mortgage Loans | Low-Income Tracts | Moderate-Income Tracts | Middle-Income Tracts | Upper-Income Tracts | Not Available-Income Tracts | |||||||||||||
|---|---|---|---|---|---|---|---|---|---|---|---|---|---|---|---|---|---|---|
| Assessment Area | # | $ | % of Total | % Businesses | % Bank Loans | Aggregate | % Businesses | % Bank Loans | Aggregate | % Businesses | % Bank Loans | Aggregate | % Businesses | % Bank Loans | Aggregate | % Businesses | % Bank Loans | Aggregate |
| Charleston-North Charleston, SC MSA | 40 | 4,301 | 71.4 | 3.7 | 5.0 | 2.9 | 28.5 | 37.5 | 26.0 | 40.0 | 37.5 | 39.3 | 27.7 | 20.0 | 31.7 | 0.0 | 0.0 | 0.0 |
| Orangeburg County, SC | 16 | 1,913 | 28.6 | 0.0 | 0.0 | 0.0 | 62.6 | 75.0 | 57.9 | 7.4 | 6.3 | 11.8 | 30.0 | 18.8 | 30.3 | 0.0 | 0.0 | 0.0 |
| Total | 56 | 6,214 | 100.0 | 3.7 | 8.9 | 2.9 | 29.2 | 48.2 | 26.6 | 39.3 | 28.6 | 38.8 | 27.8 | 19.6 | 31.7 | 0.0 | 0.0 | 0.0 |
Source: 2023 D&B Data; 01/01/2022 - 12/31/2023 Bank Data; "--" data not available. Due to rounding, totals may not equal 100.0
The total loan amount presented in the tables for each assessment area may differ from the total loan amount reported in the aggregate table due to how the underlying loan data is rounded in each table.
Table R: Assessment Area Distribution of Loans to Small Businesses by Gross Annual Revenues - 2021
| Total Loans to Small Businesses | Businesses with Revenues <= 1MM | Businesses with Revenues >1MM | Businesses with Revenues Not Available | ||||||||
|---|---|---|---|---|---|---|---|---|---|---|---|
| Assessment Area | # | $ | % of Total | Overall Market | % Businesses | % Bank Loans | Aggregate | % Businesses | % Bank Loans | % Businesses | % Bank Loans |
| Charleston-North Charleston, SC MSA | 20 | 3,166 | 58.8 | 7,979 | 87.2 | 100.00 | 47.0 | 3.2 | 0.0 | 9.5 | 0.0 |
| Orangeburg County, SC | 14 | 1,514 | 41.2 | 1,373 | 82.3 | 100.0 | 41.7 | 4.2 | 0.0 | 13.5 | 0.0 |
| Total | 34 | 4,680 | 100.0 | 9,352 | 86.3 | 100.0 | 46.3 | 3.4 | 0.0 | 10.3 | 0.0 |
ource: 2020 D&B Data; 01/01/2021 - 12/31/2021 Bank Data; "--" data not available. Due to rounding, totals may not equal 100.0
Table R: Assessment Area Distribution of Loans to Small Businesses by Gross Annual Revenues - 2022-2023
| Total Loans to Small Businesses | Businesses with Revenues <= 1MM | Businesses with Revenues >1MM | Businesses with Revenues Not Available | ||||||||
|---|---|---|---|---|---|---|---|---|---|---|---|
| Assessment Area | # | $ | % of Total | Overall Market | % Businesses | % Bank Loans | Aggregate | % Businesses | % Bank Loans | % Businesses | % Bank Loans |
| Charleston-North Charleston, SC MSA | 40 | 4,301 | 71.4 | 8,757 | 93.7 | 90.0 | 51.0 | 1.3 | 10.0 | 5.0 | 0.0 |
| Orangeburg County, SC | 16 | 1,913 | 28.6 | 152 | 92.0 | 81.3 | 44.7 | 2.0 | 18.8 | 6.0 | 0.0 |
| Total | 56 | 6,214 | 100.0 | 8,909 | 93.7 | 87.5 | 50.9 | 1.4 | 12.5 | 5.0 | 0.0 |
Source: 2023 D&B Data; 01/01/2022- 12/31/2023 Bank Data; "--" data not available. Due to rounding, totals may not equal 100.0
The total loan amount presented in the tables for each assessment area may differ from the total loan amount reported in the aggregate table due to how the underlying loan data is rounded in each table.
OFFICE LOCATIONS AND HOURS
HOLLY HILL OFFICE
801 GILWAY STREET
HOLLY HILL, SC 29059 Monday - Friday 9:00 AM - 5:00 PM
PHONE: (803) 496-5011 Census Tract 450750102.00
*HARLEYVILLE OFFICE
143 WEST MAIN ST.
HARLEYVILLE, SC 29448 Monday, Tuesday, Thursday, Friday 9:00 AM - 1:00 PM, 3:00 PM - 5:00 PM Wednesday 9:00 AM - 1:00 PM
PHONE: (843) 462-7661 Census Tract 450350103.01
SUMMERVILLE OFFICE
415 NORTH MAIN ST.
SUMMERVILLE, SC 29483 Monday - Friday 9:00 AM - 5:00 PM
PHONE: (843) 873-3310 Census Tract 450350107.00
BOONEHILL OFFICE
1400 BOONEHILL RD.
SUMMERVILLE, SC 29483 Monday - Friday 9:00 AM - 5:00 PM
PHONE: (843) 875-2100 Census Tract 450350105.07
DRIVE THRU FACILITY ONLY
*EUTAWVILLE OFFICE
12181 OLD NO. SIX HWY.
EUTAWVILLE, SC 29048. Monday, Tuesday, Thursday, Friday 9:00 AM - 1:00 PM, 3:00 PM - 5:00 PM Wednesday 450750101.04 19:00 AM - 1:00 PM
PHONE: (803) 492-7727. Census Tract 450750101.04
*RIDGEVILLE OFFICE
173 CHURCH ST.
RIDGEVILLE, SC 29472 Monday, Tuesday, Thursday, Friday 9:00 AM - 1:00 PM, 3:00 PM - 5:00 PM Wednesday 9:00 AM - 1:00 PM
PHONE: (843) 871-9553. Census Tract 450350104.00
NEXTON OFFICE
1710 N. MAIN ST
SUMMERVILLE, SC 29483 Monday - Friday 9:00 AM - 5:00 PM
PHONE: (843) 875-2584 Census Tract 450150207.13
GOOSE CREEK OFFICE
106 THOMASON BLVD.
GOOSE CREEK, SC 29445 Monday - Friday 9:00 AM -5:00 PM
PHONE: (843) 553-0344 Census Tract 450150207.07
Personal and Business Products & Miscellaneous Fees
Miscellaneous Fees
| Service | Fee |
|---|---|
| Account Closing within 90 days | $20.00 |
| Moola Moola account closing within six months | $20.00 |
| Christmas Club account closing before maturity | $10.00 |
| Account Closed in Overdraft | $20.00 |
| Balancing Service (per hour) | $25.00 |
| Cashier's Checks - Customer | $6.00 |
| Cashier's Checks - Non-Customer | $20.00 |
| Chargebacks | $15.00 |
| Chargebacks - special handling | $16.00 |
| Copies of checks, deposits, or statements | $5.00 |
| Dormant account fee | $7.00 |
| Fax - outgoing | $3.00 first page/$2.00 each additional |
| Fax - incoming | $2.00 |
| IRA transfer fee | $30.00 |
| Money Orders - Customer | $4.00 |
| Money Orders - Non-Customer | $8.00 |
| Non-sufficient funds (NSF) per item | $34.00 |
| Non-sufficient funds (NSF) special handling over $2500 | $6.00 |
| Photocopies | $.35 |
| Overdraft Fee (per item) | $34.00 |
| Replace ATM Card | $10.00 |
| Replace VISA Check Card or PIN (first time) | $10.00 |
| Replace VISA Check Card or PIN (afterfirst) | $15.00 |
| Research (per hour) | $25.00 |
| Statement - interim | $10.00 |
| Stop Payments | $35.00 |
| Tax Levies | $110.00 |
| Wire Transfers- international | $60.00 |
| Wire Transfers - incoming - Customer | $20.00 |
| Wire Transfers - incoming - Non-Customer | $35.00 |
| Wire Transfers- outgoing - Customer | $30.00 |
| Wire Transfers- outgoing - Non-Customer | $45.00 |
Personal Accounts
| Service | Fee |
|---|---|
| First Secure Checking* | |
| Minimum Daily Balance | $0.00 |
| Service Charge (paper statement) | $4.95 |
| Service Charge (electronic statement | $2.95 |
| Priority One Interest Checking | |
| Minimum Daily Balance | $500.00 |
| Service Charge if minimum not maintained | $10.00 |
| Per Debit Fee | $.50 |
| Golden Secure Checking (50+ years)** Custom FNB checks per year at no cost |
|
| Minimum Daily Balance | $7,500.00 |
| Service Charge if minimum not maintained (paper stmnt) | $4.95 |
| Service Charge if minimum not maintained (electronic) | $2.95 |
| Money Market Checking | |
| Minimum Daily Balance | $500.00 |
| Service Charge if minimum not maintained | $6.00 |
| Per Debit Fee | $.35 |
| Regular Savings | |
| Minimum Daily Balance | $200.00 |
| Service Charge if minimum not maintained | $3.00 |
| Withdrawal Fee per item (over limit of 1 per month) | $4.00 |
| Moola Moola Savings | |
| Minimum Daily Balance | $0.00 |
| Service Charge | $0.00 |
| Withdrawal Fee per item (over limit of 1 per month) | $4.00 |
| Health Savings Account | |
| Minimum Daily Balance | $0.00 |
| Monthly Maintenance Fee | $0.00 |
| Set-up Fee | $30.00 |
**Service Charge on First Secure and Golden Secure is waived if aggregate balance of consumer accounts is $20,000 or more. Accounts must receive Electronic statements.
Business Accounts
| Service | Fee |
|---|---|
| Minimum Business Checking (less than 150 items) | |
| Minimum Daily Balance | $500.00 |
| Service Charge if minimum not maintained | $8.00 |
| Per Debit Fee | $.45 |
| Analyzed Business Checking Earnings credit received based on average collected balance of 91-day Treasury bill rate (less 10% reserve) |
|
| Monthly Maintenance Charge | $10.00 |
| Per Debit Paid (non-ACH) | $.20 |
| Per Credit (non-ACH) | $.18 |
| Per Item Deposited | $.11 |
| Returned Items - Chargeback | $12.00 |
| Returned Items - Special Handling | $13.00 |
| Special Handling NSF checks over $2500 | $6.00 |
| Stop Payments | $35.00 |
| Coin Issued - per roll | $.05 |
| Currency Issued - per $100 | $.15 |
| Currency Deposited - per $100 | $.17 |
| Interest Earning Minimum Business Checking | |
| Minimum Daily Balance | $1,000.00 |
| Service Charge if minimum is not maintained | $10.00 |
| Per Debit Fee | .45 |
| Business Money Market | |
| Minimum Daily Balance | $500.00 |
| Service Charge if minimum is not maintained | $6.00 |
| Per Debit Fee | $.35 |
| Business Savings | |
| Minimum Daily Balance | $200.00 |
| Service Charge if minimum is not maintained | $3.00 |
| Withdrawal Fee per item ( over limit of 1 per month) | $4.00 |
Personal Checking
First Secure Checking
The easy answer to your check -writing hassles!
Minimum Deposit to open $50.00
No Minimum Balance Requirement
On-line Banking and Bill Pay available
ATM/Check Card available
Use of FNBSC's ATMs at no additional cost
Unlimited Check Writing
IDProtect and Cell Phone Protection
$4.95 monthly service charge with a $2.00 credit for an e-statement.
Golden Secure Checking
Age has its privileges. So if you are 50 years old or better, then this is the interest-earning account for you.
Minimum Deposit to open $50.00
Minimum Balance to Avoid Maintenance Fees: $7500
If the balance falls below $7500 at any time during the statement cycle, there is a $4.95 maintenance fee per
statement cycle with a $2.00 credit if the account receives an e-statement. *
On-line Banking and Bill Pay available
ATM/ Check Card available
Use ofFNBSC's ATMs at no additional cost
Unlimited Check Writing
IDProtect and Cell Phone Protection
One order of FNB Custom Checks per year at no cost.
Variable Interest Paid on Collected Balance
(please see a CSR for current rate infonnation)
Tier 1: $0.00 - $2499.99
Tier 2: $2500.00 - $9999.99
Tier 3: $10,000.00 - $24,999.99
Tier 4: $25,000 & up
*Service Charge on First Secure and Golden Secure is waived if aggregate balance of consumer accounts is $20,000 or more.
Accounts must receive electronic statements.
Golden Opportunities Club
If you maintain a $2500 average monthly balance in an FNB checking account, savings account, or certificate of deposit (term of 6 months or longer), then you will be eligible to join our Golden Opportunities Club. You will receive exciting newsletters and enjoy seminars on topics especially concerning Senior Citizens. We even have special social events each month and group travel opportunities.
Priority One Checking
For those customers who want the advantages of a low minimum balance checking AND the ability to earn premium interest on their money.
Minimum Deposit to open $50.00
Minimum Balance to Avoid Maintenance Fees: $500
If the balance falls below $500 at any time during the statement cycle, there is a $10.00 maintenance fee per statement
cycle, plus $.45 per check or debit fee.
Variable Interest Paid on Collected Balance
(please see a CSRfor current rate infonnation)
Tier 1: $0.00 - $2499.99
Tier 2: $2500.00 - $9999.99
Tier 3: $10,000.00 - $24,999.99
Tier 4: $25,000 & up
Personal Savings
Money Market Account
For those individuals who want their money to earn premium interest rates associated with a Certificate of Deposit while maintaining the accessibility of funds through a checking account.
Minimum Deposit to Open: $500
Minimum Balance to Avoid Maintenance Fees: $500
If the balance falls below $500 at any time during the statement cycle, there is a $6.00 maintenance fee per statement cycle, plus $.35 per check or debit fee
Number of Transactions are limited to Six (6) per statement cycle by check, draft, debit card or similar order to third parties.
Variable Interest Paid on Collected Balance.
(please see a CSR for current rate information)
Tier 1: $0.00 - $2499.99
Tier 2: $2500.00 - $9999.99
Tier 3: $10,000.00 - $24,999.99
Tier 4: $25,000 & up
Regular Savings Account
This account is available to individuals or businesses who want an interest-bearing account for their money with unlimited deposit availability.
Minimum Deposit to Open: $50
Minimum Balance to Avoid Maintenance Fees: $200
If the balance falls below $200 during the month, a $3.00 monthly maintenance fee is charged.
One debit per month allowed - Excess debit fee: $4.00 per debit
Number of Transactions are limited to Six (6) per statement cycle by draft, debit card or similar order to third parties.
Quarterly Statements
Please see a CSR for Current Rate Information
Moola Moola Savings Account
A super way for the little tykes to being a savings program! If you child is 12 years or age or younger, then they can join the Moola Moola Club. Special incentives are awarded when certain savings goals are met.
Minimum Deposit to Open: $25
Minimum Balance to Maintain Membership: $25
One debit per month allowed - Excess debit fee: $4.00 per debit
Number of Transactions are limited to Six (6) per statement cycle by draft, debit card or similar order to third parties.
Early Withdrawal Penalty if account is closed within Six (6) months of opening: $20.00
Quarterly Statements
Please see a CSR for Current Rate Information
Christmas Club Savings Account
Avoid those bill-paying blues that come every December by opening a Christmas Club Savings Account today! Small weekly or monthly deposits throughout the year can make Christmas a whole lot merrier.
Minimum Deposit to Open: $5
Account Pays out by check each October
Interest-earning IF deposits are made by Automatic Draft or EFT Transaction.
(please see a CSR for current rate iriformation)
Early Withdrawal Penalty if Account is closed prior to maturity: $10.00 fee. All interest will be forfeited
Certificates of Deposit & IRAs
Certificates of Deposit
Our fixed-rate CDs offer a safe place for you to invest your money away from the fluctuations and insecurities often found in the stock market. You will know that the money is earning a competitive rate of interest during the length of time you choose.
Minimum Deposit to Open: $500
Minimum Balance Requirements:
1 - 5 months: $500.00
6 - 11 months: $500.00
12 - 17 months: $500.00
18 - 23 months: $500.00
24 - 29 months: $500.00
30+months: $500.00
Golden Opportunities Club Member 12 month: $2,500.00Substantial Interest Penalty for Early Withdrawal
Individual Retirement Account
Avoid the tax man by investing in an IRA today. Not only will you receive a tax-deferred savings on your yearly income tax, but you will also be investing in your future by setting aside a retirement "nest egg". We offer variable and fixed rate IRAs with a 12 and 18 month term. Remember to consult your tax advisor regarding specific tax deductibility.
Health Savings Account
The purpose of a Health Savings Account is to pay, on a tax-free basis, the qualified medical expenses of an HSA owner and his family. To be eligible for a Health Savings Account, you must generally:
Be covered under a high-deductible health plan (HDHP)
Not be covered by any other health plan that is not a HDHP
Not be entitled to benefits under Medicare
Not be eligible to be claimed as a dependent on another person's tax return
Minimum Deposit to Open: $100.00
One time set-up Fee: $30.00
Please see a CSR for Current Rate Information
Visa Check Card will be issued for payment of qualified medical expenses
Refer to IRS Publication 969 Health Savings Accounts
Refer to IRS Publication 502 Medical and Dental Expenses
Business Checking
Minimum Business Checking
At First National Bank of South Carolina, we understand the needs of a small business. This account was created for those businesses with low volume and a need for a lower minimum balance requirement.
Minimum Deposit to Open: $200
Minimum Balance to A void Maintenance Fees: $500
If the balance falls below $500 at any time during the statement cycle, there is a $8.00 maintenance fee, plus a $.45 per check or debit fee.
Limited to 150 transaction items per statement cycle.
On-line banking/Bill Pay available.
ATM/ Check Card available
USE of FNBSC's ATMs at no additional cost
Imaged Checks returned with each monthly statement
Commercial Analysis Checking
As your business grows, so does your account activity. If you process more than 150 items per statement cycle, then this is the account for you. Monthly fees are determined based on the activity of the account after an earnings credit reduction.
Minimum Deposit to Open: $200
Monthly Maintenance Fee: $10.00
Per Item Paid: $.20 non-ACH
Per Deposit: $.18 non-ACH
Per Deposit item: $.11
Coin Issued - per roll: $.05
Currency Issued - per $100: $.15On-line banking/Bill Pay available
ATM/Visa Check Card available
Use of FNBSC's ATMs at no additional charge
Imaged Checks returned with each monthly statement
Interest Earning Business Checking
This interest bearing check account is available to Non-Profit organizations, Sole Proprietorships, Estates, Churches and Trust or Escrow Accounts.
NOW Minimum Business Checking
An interest bearing checking account for low volume businesses.
Minimum Deposit to Open: $200
Minimum Balance to Avoid Maintenance Fees: $1000
If the balance falls below $1000 at any time during the statement cycle, there is a $10.00 maintenance fee, plus a $.45 per check or debit fee.
Limited to 150 transaction items per statement cycle.
On-line banking/Bill Pay available
ATM/VISA Check Card available
USE of FNBSC's ATMs at no additional charge
Imaged Checks returned with each monthly statement
Please see a CSR for Current Rate Information.
Business Savings
Money Market Account
For those businesses who want their money to earn premium interest rates associated with a Certificate of Deposit while maintaining the accessibility of funds through a checking account.
Minimum Deposit to Open: $500
Minimum Balance to Avoid Maintenance Fees: $500
If the balance falls below $500 at any time during the statement cycle, there is a $6.00 maintenance fee per statement cycle, plus $.35 per check or debit fee
Number of Transactions are limited to Six (6) per statement cycle by check, draft, debit card or similar order to third parties.
Variable Interest Paid on Collected Balance.
(please see a CSR for current rate information)
Tier 1: $0.00 - $2499.99
Tier 2: $2500.00 - $9999.99
Tier 3: $10,000.00 - $24,999.99
Tier 4: $25,000 & up
Business Savings Account
This account is available to businesses who want an interest-bearing account for their money with unlimited deposit availability.
Minimum Deposit to Open: $50
Minimum Balance to Avoid Maintenance Fees: $200
If the balance falls below $200 during the month, a $3.00 monthly maintenance fee is charged.
One debit per month allowed - Excess debit fee: $4.00 per debit
Number of Transactions are limited to Six (6) per statement cycle by draft, debit card or similar order to third parties.
Quarterly Statements
Please see a CSR for Current Rate Information
Merchant Services
At First National Bank of South Carolina, we understand that our customers need the right financial tools to grow their business and to build customer loyalty. While other banks may promise an array of Merchant Services products, First National Bank of South Carolina goes further - Quality Customer Service with very competitive pricing. Regardless of your Merchant Services needs, we have the products to fit your business.
To find out more, please contact one of our Customer Service Representatives.
Personal Loans
We are pleased to offer secured and unsecured personal loans for your use. Whether you need to make home repairs, buy a new car or truck, or consolidate debt, we are here to help. Just ask for one of our friendly loan officers who will be happy to assist you. Upon credit approval, we can set up your simple-interest loan with convenient, easy payments.
Mortgages
First National Bank of South Carolina has loan packages to suit nearly every customer in any phase of their life. A Mortgage Specialist is available to guide you through one of the largest investments you will ever make. At First National Bank of South Carolina, our goal is to offer loans to everyone while providing the lowest rates and closing costs possible.
Commercial Loans
In today's economic environment, you need a bank that will function in your best interest; a bank that has flexible loan options; a bank that's the ONE for You and Your Business. First National Bank of South Carolina is here to help if your business needs a loan for expansion, debt consolidation or fixed-asset purchases. See one of our loan officers for any of the following types of loans:
Secured
Unsecured
Single Payment Loans
Term Loans
Letters of Credit
Lines of Credit
Rural Development Guaranteed Loans
Miscellaneous Services
Online Banking & Bill Pay
ATM Cards/Visa Check Cards
Wire Transfers
Direct Deposit Service
Night Deposit Service
Bank by Mail
Cashier's Checks
Money Orders
FAX Services
Drive-in Banking
24-Hour Automated Teller Machines
24-Hour Touch Tone Banking
Mobile Banking
Mobile Deposit
Savings Bonds Redeemed
FNB Financial Services
Please contact T.J. Faber @ www.tjfaber.com for your investment needs.
Phone number (704) 703-2125 or email at tfaber@bbridgefin.com.
Full Service Brokerage
Asset Management
Retirement Planning
Investment Planning
Insurance Planning
Asset Allocation
Portfolio Analysis
Comprehensive Financial Analysis
Stocks Bonds Mutual Funds
Life & Long Term Care Insurance
IRA's, Tax-Deferred Annuities
529 Plans
Not FDIC Insured - Not Bank Guaranteed - Not Insured by any Government Agency - May Lose Value - Not a Bank Deposit
FIRST NATIONAL BANK OF SOUTH CAROLINA - DORCHESTER BERKELEY ASSESSMENT AREA 2024
| State Code | County Code | Tract Code | Complete Tract | Tract Income Class | Tract Minority Status | Total Persons |
|---|---|---|---|---|---|---|
| 45 | 015 | 201.01 | 45015020101 | Moderate | Majority Minority Tract | 2974 |
| 45 | 015 | 201.02 | 45015020102 | Moderate | Non-Majority Minority Tract | 4063 |
| 45 | 015 | 202.01 | 45015020201 | Low | Majority Minority Tract | 3507 |
| 45 | 015 | 202.02 | 45015020202 | Low | Majority Minority Tract | 2926 |
| 45 | 015 | 203.01 | 45015020301 | Moderate | Non-Majority Minority Tract | 3062 |
| 45 | 015 | 203.03 | 45015020303 | Moderate | Majority Minority Tract | 1833 |
| 45 | 015 | 204.04 | 45015020304 | Moderate | Non-Majority Minority Tract | 4476 |
| 45 | 015 | 204.01 | 45015020401 | Low | Non-Majority Minority Tract | 3890 |
| 45 | 015 | 204.04 | 45015020404 | Upper | Non-Majority Minority Tract | 6963 |
| 45 | 015 | 204.05 | 45015020405 | Moderate | Majority Minority Tract | 3447 |
| 45 | 015 | 204.06 | 45015020406 | Upper | Non-Majority Minority Tract | 2858 |
| 45 | 015 | 204.07 | 45015020407 | Upper | Non-Majority Minority Tract | 9274 |
| 45 | 015 | 205.03 | 45015020503 | Middle | Non-Majority Minority Tract | 5227 |
| 45 | 015 | 205.04 | 45015020504 | Moderate | Non-Majority Minority Tract | 4151 |
| 45 | 015 | 205.05 | 45015020505 | Middle | Majority Minority Tract | 4699 |
| 45 | 015 | 205.06 | 45015020506 | Moderate | Non-Majority Minority Tract | 6008 |
| 45 | 015 | 206.01 | 45015020601 | Middle | Non-Majority Minority Tract | 4792 |
| 45 | 015 | 206.02 | 45015020602 | Middle | Non-Majority Minority Tract | 7949 |
| 45 | 015 | 207.07 | 45015020707 | Middle | Non-Majority Minority Tract | 7411 |
| 45 | 015 | 207.10 | 45015020710 | Middle | Non-Majority Minority Tract | 7202 |
| 45 | 015 | 207.11 | 45015020711 | Upper | Non-Majority Minority Tract | 14020 |
| 45 | 015 | 207.12 | 45015020712 | Moderate | Non-Majority Minority Tract | 3411 |
| 45 | 015 | 207.13 | 45015020713 | Middle | Non-Majority Minority Tract | 7268 |
| 45 | 015 | 207.14 | 45015020714 | Middle | Non-Majority Minority Tract | 6016 |
| 45 | 015 | 207.15 | 45015020715 | Moderate | Non-Majority Minority Tract | 3912 |
| 45 | 015 | 207.16 | 45015020716 | Middle | Non-Majority Minority Tract | 8619 |
| 45 | 015 | 207.17 | 45015020717 | Moderate | Majority Minority Tract | 5246 |
| 45 | 015 | 207.18 | 45015020718 | Moderate | Majority Minority Tract | 6953 |
| 45 | 015 | 207.19 | 45015020719 | Moderate | Non-Majority Minority Tract | 5283 |
| 45 | 015 | 207.20 | 45015020720 | Middle | Non-Majority Minority Tract | 4816 |
| 45 | 015 | 207.21 | 45015020721 | Upper | Non-Majority Minority Tract | 3384 |
| 45 | 015 | 207.22 | 45015020722 | Upper | Non-Majority Minority Tract | 3151 |
| 45 | 015 | 207.23 | 45015020723 | Middle | Non-Majority Minority Tract | 3093 |
| Total Minority Population | Minority Population % |
|---|---|
| 1803 | 60.63 |
| 1704 | 41.94 |
| 1859 | 53.01 |
| 2547 | 87.05 |
| 567 | 18.52 |
| 985 | 53.74 |
| 983 | 21.96 |
| 1447 | 37.2 |
| 1457 | 20.92 |
| 1995 | 57.88 |
| 357 | 12.49 |
| 1145 | 12.35 |
| 1776 | 33.98 |
| 1993 | 48.01 |
| 2401 | 51.1 |
| 2833 | 47.15 |
| 1669 | 34.83 |
| 3077 | 38.71 |
| 3528 | 47.6 |
| 2876 | 39.93 |
| 3925 | 28 |
| 708 | 20.76 |
| 2312 | 31.81 |
| 2305 | 38.31 |
| 1480 | 37.83 |
| 3833 | 44.47 |
| 2686 | 51.2 |
| 3879 | 55.79 |
| 2227 | 42.15 |
| 1228 | 25.5 |
| 1297 | 38.33 |
| 760 | 24.12 |
| 1243 | 40.19 |
| State Code | County Code | Tract Code | Complete Tract | Tract Income Class | Tract Minority Status | Total Persons |
|---|---|---|---|---|---|---|
| 45 | 015 | 207.24 | 45015020724 | Middle | Non-Majority Minority Tract | 4034 |
| 45 | 015 | 207.24 | 45015020725 | Moderate | Non-Majority Minority Tract | 1562 |
| 45 | 015 | 208.04 | 45015020804 | Moderate | Majority Minority Tract | 3030 |
| 45 | 015 | 208.06 | 45015020806 | Moderate | Non-Majority Minority Tract | 3717 |
| 45 | 015 | 208.07 | 45015020807 | Upper | Majority Minority Tract | 10031 |
| 45 | 015 | 208.08 | 45015020808 | Middle | Majority Minority Tract | 3802 |
| 45 | 015 | 208.09 | 45015020809 | Moderate | Majority Minority Tract | 3294 |
| 45 | 015 | 208.10 | 45015020810 | Moderate | Majority Minority Tract | 3861 |
| 45 | 015 | 208.11 | 45015020811 | Moderate | Majority Minority Tract | 4779 |
| 45 | 015 | 208.12 | 45015020812 | Upper | Non-Majority Minority Tract | 6008 |
| 45 | 015 | 209.01 | 45015020901 | Low | Non-Majority Minority Tract | 1652 |
| 45 | 015 | 209.03 | 45015020903 | Middle | Non-Majority Minority Tract | 3412 |
| 45 | 015 | 209.04 | 45015020904 | Middle | Non-Majority Minority Tract | 4129 |
| 45 | 015 | 210 | 45015021000 | Moderate | Non-Majority Minority Tract | 4666 |
| 45 | 015 | 9801 | 45015980100 | Unknown | Non-Majority Minority Tract | 0 |
| 45 | 035 | 101 | 45035010100 | Moderate | Non-Majority Minority Tract | 2527 |
| 45 | 035 | 102 | 45035010200 | Low | Majority Minority Tract | 4745 |
| 45 | 035 | 103.01 | 45035010301 | Moderate | Non-Majority Minority Tract | 2127 |
| 45 | 035 | 103.02 | 45035010302 | Moderate | Non-Majority Minority Tract | 3433 |
| 45 | 035 | 104 | 45035010400 | Middle | Non-Majority Minority Tract | 6367 |
| 45 | 035 | 105.01 | 45035010501 | Middle | Non-Majority Minority Tract | 7294 |
| 45 | 035 | 105.03 | 45035010503 | Middle | Non-Majority Minority Tract | 5966 |
| 45 | 035 | 105.05 | 45035010505 | Middle | Non-Majority Minority Tract | 6635 |
| 45 | 035 | 105.06 | 45035010506 | Middle | Non-Majority Minority Tract | 2060 |
| 45 | 035 | 105.07 | 45035010507 | Middle | Non-Majority Minority Tract | 2398 |
| 45 | 035 | 105.08 | 45035010508 | Upper | Non-Majority Minority Tract | 3691 |
| 45 | 035 | 106.03 | 45035010603 | Upper | Non-Majority Minority Tract | 8338 |
| 45 | 035 | 106.04 | 45035010604 | Upper | Non-Majority Minority Tract | 4449 |
| 45 | 035 | 106.06 | 45035010606 | Upper | Non-Majority Minority Tract | 1898 |
| 45 | 035 | 106.07 | 45035010607 | Middle | Non-Majority Minority Tract | 5272 |
| 45 | 035 | 106.08 | 45035010608 | Moderate | Non-Majority Minority Tract | 3654 |
| 45 | 035 | 107 | 45035010700 | Moderate | Non-Majority Minority Tract | 5738 |
| 45 | 035 | 108.01 | 45035010801 | Upper | Non-Majority Minority Tract | 6861 |
| 45 | 035 | 108.07 | 45035010807 | Middle | Non-Majority Minority Tract | 5254 |
| Total Minority Population | Minority Population % |
|---|---|
| 1240 | 30.74 |
| 503 | 32.2 |
| 1861 | 61.42 |
| 1834 | 49.34 |
| 5296 | 52.8 |
| 2210 | 58.13 |
| 1776 | 53.92 |
| 2344 | 60.71 |
| 3021 | 63.21 |
| 1556 | 25.9 |
| 746 | 45.16 |
| 1002 | 29.37 |
| 1582 | 38.31 |
| 2165 | 46.4 |
| 0 | 0 |
| 1078 | 42.66 |
| 2586 | 54.5 |
| 828 | 38.93 |
| 1447 | 42.15 |
| 2971 | 46.66 |
| 2368 | 32.47 |
| 1420 | 23.8 |
| 1895 | 28.56 |
| 705 | 34.22 |
| 1021 | 42.74 |
| 1277 | 34.6 |
| 2638 | 31.64 |
| 1440 | 32.37 |
| 341 | 17.97 |
| 1742 | 33.04 |
| 995 | 27.23 |
| 2776 | 48.38 |
| 1538 | 22.42 |
| 1427 | 27.16 |
| State Code | County Code | Tract Code | Complete Tract | Tract Income Class | Tract Minority Status | Total Persons |
|---|---|---|---|---|---|---|
| 45 | 035 | 108.08 | 45035010808 | Middle | Non-Majority Minority Tract | 7394 |
| 45 | 035 | 108.09 | 45035010809 | Middle | Non-Majority Minority Tract | 3663 |
| 45 | 035 | 108.13 | 45035010813 | Moderate | Non-Majority Minority Tract | 9041 |
| 45 | 035 | 108.14 | 45035010814 | Middle | Non-Majority Minority Tract | 6622 |
| 45 | 035 | 108.15 | 45035010815 | Moderate | Non-Majority Minority Tract | 2986 |
| 45 | 035 | 108.17 | 45035010817 | Middle | Non-Majority Minority Tract | 6773 |
| 45 | 035 | 108.18 | 45035010818 | Moderate | Majority Minority Tract | 9316 |
| 45 | 035 | 108.19 | 45035010819 | Upper | Non-Majority Minority Tract | 5009 |
| 45 | 035 | 108.20 | 45035010820 | Middle | Non-Majority Minority Tract | 7209 |
| 45 | 035 | 108.21 | 45035010821 | Middle | Non-Majority Minority Tract | 2322 |
| 45 | 035 | 108.22 | 45035010822 | Upper | Non-Majority Minority Tract | 3866 |
| 45 | 035 | 108.23 | 45035010823 | Middle | Non-Majority Minority Tract | 8641 |
| Total Minority Population | Minority Population % |
|---|---|
| 2239 | 30.28 |
| 1067 | 29.13 |
| 3558 | 39.35 |
| 2659 | 40.15 |
| 1401 | 46.92 |
| 2729 | 40.29 |
| 6535 | 70.15 |
| 1947 | 38.87 |
| 3206 | 44.47 |
| 855 | 36.82 |
| 1662 | 42.99 |
| 4044 | 46.80 |
FIRST NATIONAL BANK OF SOUTH CAROLINA - ORANGEBURG ASSESSMENT AREA 2024
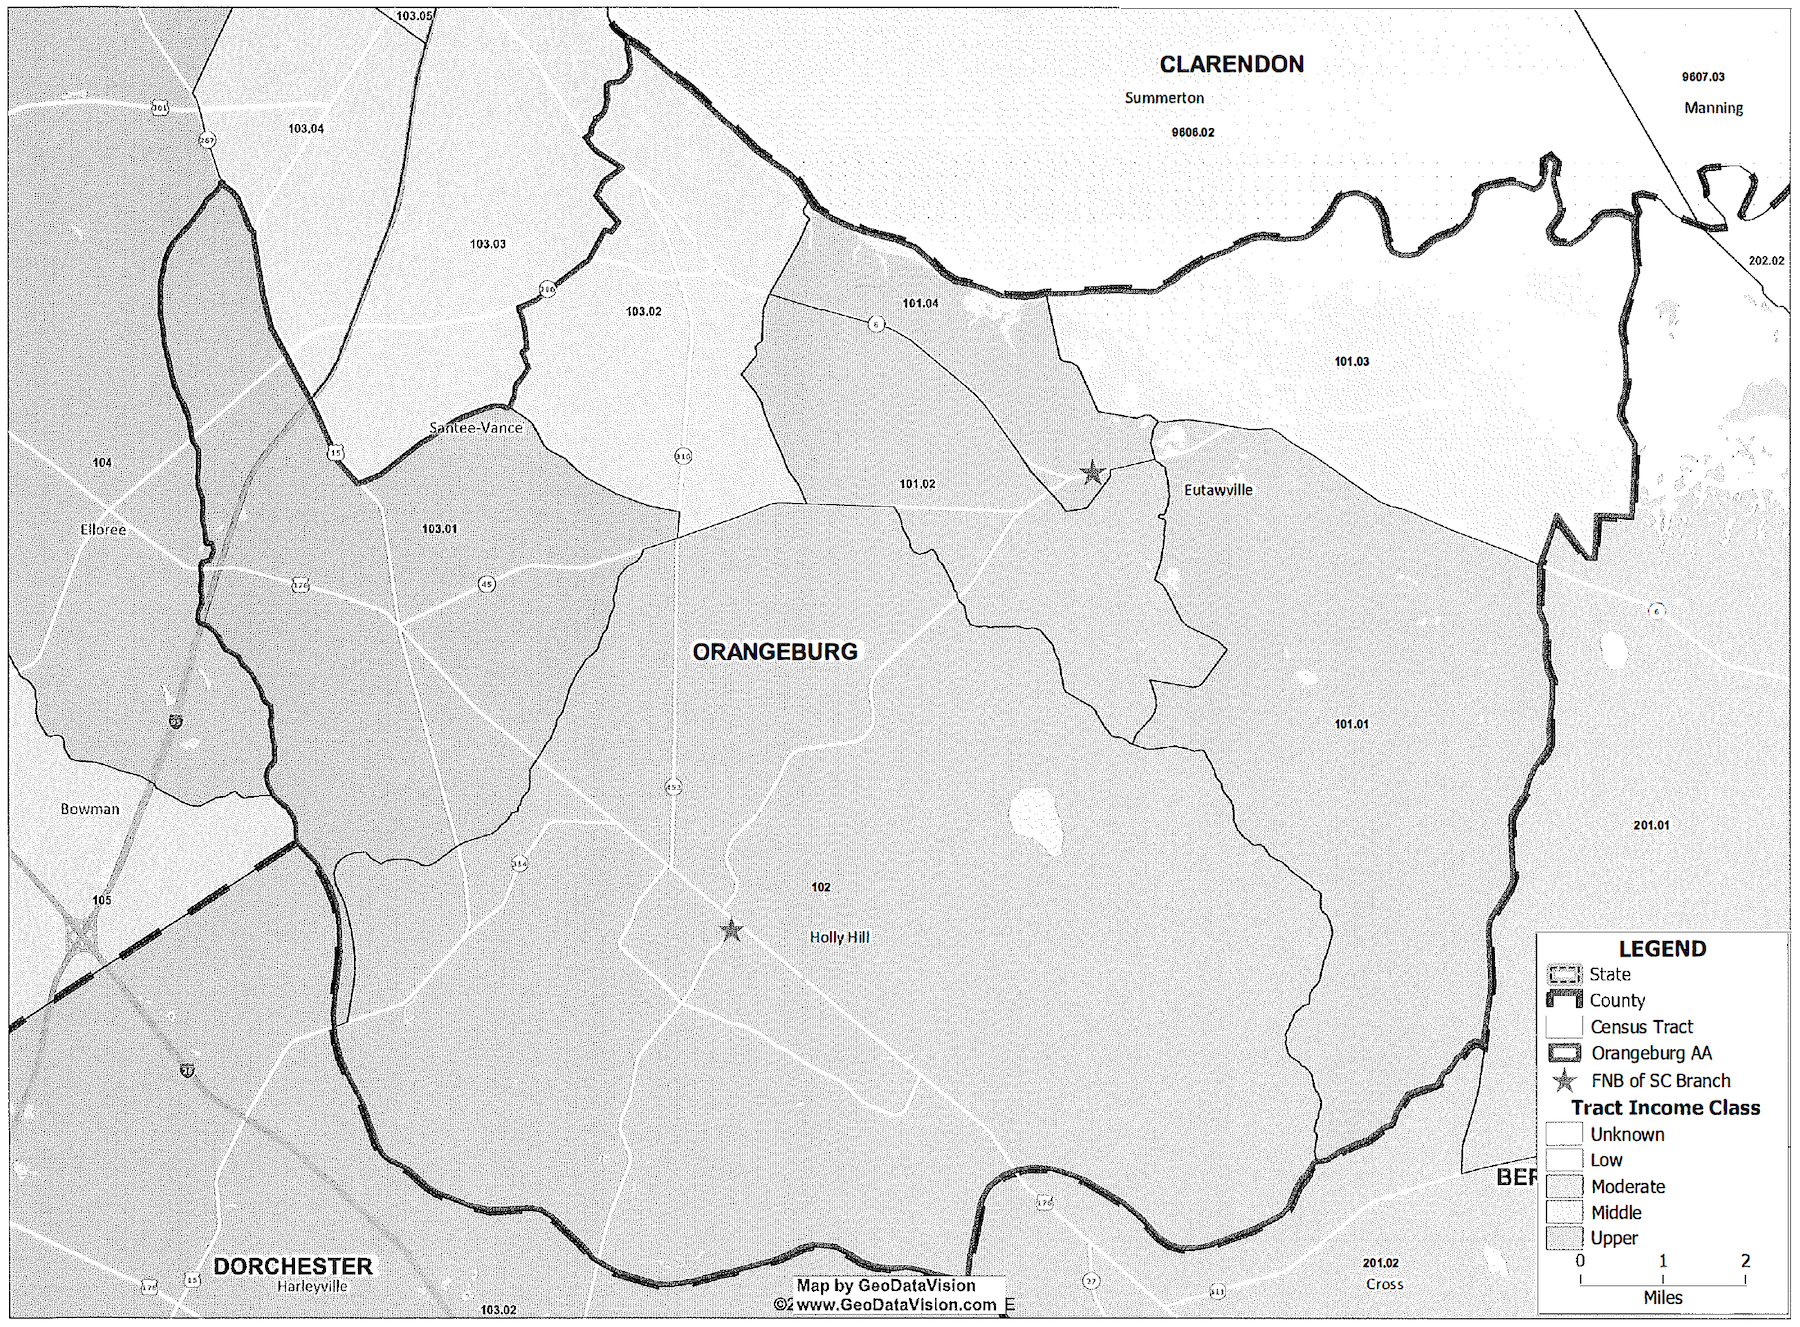
| State Code | County Code | Tract Code | Complete Tract | Tract Income Class | Tract Minority Status | Total Persons |
|---|---|---|---|---|---|---|
| 45 | 075 | 101.01 | 45075010101 | Upper | Majority Minority Tract | 1729 |
| 45 | 075 | 101.02 | 45075010102 | Moderate | Majority Minority Tract | 1098 |
| 45 | 075 | 101.03 | 45075010103 | Middle | Non-Majority Minority Tract | 865 |
| 45 | 075 | 101.04 | 45075010104 | Upper | Non-Majority Minority Tract | 967 |
| 45 | 075 | 102 | 45075010200 | Moderate | Majority Minority Tract | 4730 |
| 45 | 075 | 103.01 | 45075010301 | Upper | Majority Minority Tract | 1185 |
| 45 | 075 | 103.02 | 45075010302 | Middle | Majority Minority Tract | 1054 |
| Total Minority Population | Minority Population % |
|---|---|
| 1214 | 70.21 |
| 912 | 83.06 |
| 111 | 12.83 |
| 482 | 49.84 |
| 3238 | 68.46 |
| 906 | 76.46 |
| 826 | 78.37 |
Home Mortgage Disclosure Act Notice
The HMDA data about our residential mortgage lending are available online for review. The data show geographic distribution of loans and applications, ethnicity, race, sex, age, and income of applicants and borrowers, and information about loan approvals and denials. These data are available online at the Consumer Financial Protection Bureau's Web site (www.consumerfinance.gov/hmda). HMDA data for many other financial institutions are also available at this Web site.
Loan to Deposit Ratio
The following is the bank's loan to deposit ratio by quarter:
| Quarter Ending | Ratio (%) |
|---|---|
| March 31, 2023 | 51.62 |
| June 30, 2023 | 52.63 |
| September 30, 2023 | 53.44 |
| December 31, 2023 | 55.16 |
Mission Statement for 2026
Our primary mission is to deliver quality and profitable products with professional service in all areas we serve.
We resolve that we will offer and market our products and services to all segments and areas of our Assessment area.
Further, we will keep informed of the credit needs of the people and communities in our Assessment area and will respond to theses needs in a positive manner.
We will continue to invest in municipal bonds, when they are available, from counties where most of our customers live and work and those municipal bonds that serve our area's customers.
Goals
Maintain our loan to deposit ratio in the 65 % to 75 % range.
Continue to meet the loan needs of consumer and business borrowers from all income levels, including low to moderate income customers.
Ensure that our loans are well distributed within our Assessment are, including low- and moderate-income areas.
Although we have had no complaints, we will respond to all complaints in a positive and timely manner.
Implementing Goals
We will endeavor to maintain loan volume by marketing our loan products. Ads should include 1 to 4 family residential, small business, small farm, and other special products that would be beneficial to low to moderate income customers.
Review and design loan products to be sure we have something to offer to meet the needs of as many as possible of the borrowers in our Assessment area.
Monitor loans by census tract to see is any area ( s) of our Assessment area are being excluded. If any are being excluded, try to determine why.
Monitor Fair Lending as loans are booked and reviewed.
CRA Assessment for 2025 Loans
Our loan analysis by officer report for 12/31/25 shows that FNB has 951 loans in the amount of $146,282,014.07 during 2025.
Info from CRA Information sheets completed by loan officers for all new extensions of credit during 2025 show that loans were to the following categories:
| Category | Number | Amount | % of Total |
|---|---|---|---|
| One to four family housing (const, purchase, refi or improve) |
53 | $17,097,762.17 | 22.11 |
| Small Business | 76 | $10,717,502.01 | 13.86 |
| Agricultural/Farm purpose | 5 | $569,490.10 | 0.74 |
| SBA/RD guaranteed | 0 | $0 | 0 |
| Public sector (churches, schools, and municipalities) |
13 | $3,051,764.28 | 3.95 |
| Economic Development | 0 | $0 | 0 |
| Other consumer loans | 145 | $45,906,105.60 | 59.35 |
| Total | 292 | $77,342,624.16 | |
| Loans made to borrowers who live in low to moderate income tracts | 59 | $ 9,673,714.86 | |